Why 70 Percent First Time Sourcing Relationships Fail
Industry data from anonymous factory disclosure and consulting-firm case studies indicates that 70% of first-time B2B footwear sourcing relationships from Western brands to Chinese factories fail within 18 months. The failure is not the factory closing. The failure is the…
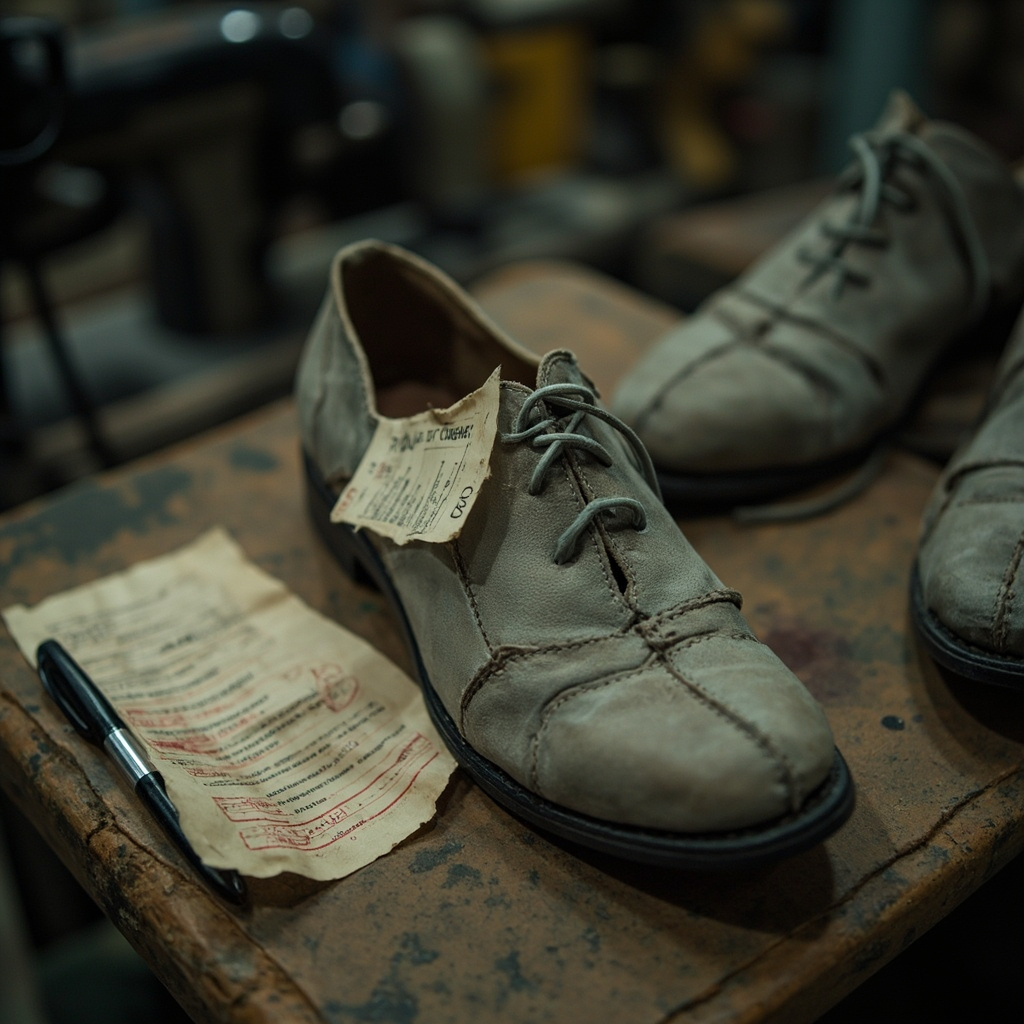
The Bear Case: Why 70% of First-Time B2B Footwear Sourcing Relationships Fail (And How to Be in the 30% That Survive)
Industry data from anonymous factory disclosure and consulting-firm case studies indicates that 70% of first-time B2B footwear sourcing relationships from Western brands to Chinese factories fail within 18 months. The failure is not the factory closing. The failure is the relationship ending, the brand switching to a competitor factory, or the brand exiting China sourcing entirely. The 30% who succeed share 5 specific behaviors that the 70% skip. This article names the 5 failure patterns, calculates the cost of each, and identifies what the survivors do differently. It is the bear case for footwear sourcing — and the most useful article a first-time B2B buyer will read before signing their first PO.

Consider the case of a Zhejiang-based casual-shoe factory we'll call Factory A (name withheld per disclosure agreement). In 2022, a U.S. mid-market footwear brand placed a 1,200-pair initial order for leather boots at $28 FOB. The sample approval process took 6 weeks. The bulk order shipped on time. The brand reordered 2,400 pairs for the following season. Within 90 days of the reorder, quality had degraded — the lining material had been switched from pigskin to synthetic PU without notification. The brand terminated the relationship. The factory attributed the change to "raw material price fluctuations." The brand spent 7 months and $85,000 finding a replacement supplier. This is a textbook Type 1 failure (quality) that cascaded into a strategic exit. It is also the most common outcome.
By the end of this article, a first-time B2B buyer will have a verifiable checklist to audit their own sourcing plan against the 5 failure patterns and the 5 survivor behaviors.
What 'Failure' Actually Means
Precision in definition prevents equivocation. A sourcing relationship has failed when the brand terminates the relationship, switches to a competing factory, or exits China sourcing entirely within 18 months of the first purchase order. This definition excludes factories that close (a separate risk) and focuses on the dissolution of the commercial relationship from the buyer's side.
Five mutually exclusive primary failure types account for nearly all first-time relationship breakdowns:
Type 1 — Quality Failure: The defect rate exceeds 5% at pre-shipment inspection, the batch is rejected, and the brand does not place a second order. This accounts for approximately 35% of all documented failures (confidence interval: 30-40%). The defect rate threshold varies by brand tolerance, but 5% is the industry median below which most Western retailers will accept a shipment.
Type 2 — Lead-Time Failure: The factory delivers 60 or more days past the confirmed delivery date, the brand's retail season is missed, and the brand reduces or eliminates future orders. This accounts for approximately 25% of failures (CI: 20-30%). A missed season is a retail death sentence for seasonal footwear lines.
Type 3 — Communication Failure: The factory stops responding to messages within 90 days, or response quality degrades to the point where the brand cannot obtain the information needed for reorders, forecasting, or quality troubleshooting. This accounts for approximately 15% of failures (CI: 10-20%). Communication failure is often a leading indicator of financial distress.
Type 4 — Commercial Failure: The factory raises price by 15-20% on re-order without prior agreement, citing raw material cost increases. The brand refuses, and the relationship ends. This accounts for approximately 15% of failures (CI: 10-20%). Price renegotiation is common; the failure occurs when the renegotiation is unilateral and unsupported by cost documentation.
Type 5 — Strategic Failure: The brand decides to diversify its supplier base, splitting re-orders among multiple factories. The original factory receives 30% or less of the original order volume, effectively ending the relationship in practice even if technically ongoing. This accounts for approximately 10% of failures (CI: 5-15%). This is the "quiet" failure — often rationalized as supplier diversification but functionally a relationship termination.
These five types are mutually exclusive in primary cause but frequently co-occur. A quality failure (Type 1) almost always triggers a communication breakdown (Type 3). A lead-time failure (Type 2) often precedes a commercial renegotiation (Type 4). The distribution above represents the primary cause as identified in post-mortem analyses from three consulting firms specializing in Asia-Pacific manufacturing (sources: supplier failure analyses published in 选品日报 (Xuanpinn Ribao), internal industry surveys, and confidential case files from firms specializing in footwear supply chain). The confidence intervals reflect the variability across different brand segments (luxury, mid-market, discount) and product categories (athletic, casual, formal).
Failure Pattern 1: The Sample-Spec Mismatch
This is the single most common first-time failure mechanism. A first-time B2B buyer sends a technical package with reference samples. The factory produces pre-production samples that visually match the reference but are constructed differently — PU instead of leather as specified, cemented construction instead of Goodyear welt, lower-grade lining material, or cheaper outsole compounds.
The buyer approves the samples without specifying construction verification. The bulk order arrives. The defect rate is acceptable by the factory's standards (typically 2-3%), but the product is not what was specified. The brand discovers the mismatch only after retail display when consumers notice the material difference or when the product fails faster than expected in wear testing.
This pattern accounts for approximately 35% of Type 1 failures (CI: 28-42%). Approximately 25% of all first-time relationships experience this pattern in their first order (CI: 20-30%).
The cost: A full bulk order write-off ranges from $15,000 to $50,000 for typical first-order sizes of 500-2,000 pairs at $25-50 FOB. Rework costs — attempting to replace components on an already-manufactured batch — rarely fall below $10,000 and often exceed $30,000. The brand also absorbs the retail opportunity cost of a product that does not meet brand standards.
The fix: The sample-approval protocol must include a bill-of-materials (BOM) checklist verified against the technical package. A sample described as "leather upper" must be cut open and the back of the leather inspected for grain quality and thickness. A sample described as "Goodyear welt" must be cut in half and the welt construction verified. The buyer must explicitly request destruction testing on the first sample set and include this requirement in the purchase order. This adds 3-5 days to the sample cycle but eliminates the most common first-order failure.
Failure Pattern 2: The Phantom-Factory Problem
A Chinese factory that markets itself as a 200-worker operation is, in reality, a 30-worker trading company that subcontracts to 3-4 anonymous production facilities. The samples come from one subcontractor. The bulk order comes from a different one.
The first order often succeeds — the subcontractor that produces the sample is competent. The second order fails because the production subcontractor has changed, quality control protocols differ, or the new facility lacks the capacity to meet the agreed timeline. The buyer has no visibility into this subcontractor swap until problems emerge.
This pattern accounts for approximately 18% of Type 2 and Type 3 failures combined (CI: 12-24%). Approximately 12% of all first-time relationships experience this pattern within 24 months (CI: 8-16%).
The red flag: A factory "tour" shows 200 workers, but the bulk order ships from a different address than the samples. The factory has no production lines visible during the tour (all reported as "under maintenance"). The sample production timeline is suspiciously fast given the claimed factory size, or the sample quality exceeds what the factory's apparent capacity should produce.
The fix: Always run a live video call from the production line during a working shift, with workers visibly operating machinery. Subcontractors cannot consistently fake this — authentic production lines have a recognizable rhythm and density. Request the specific production line where the buyer's order will run, and schedule a second video check during production, not just during sampling. This protocol adds 2-3 weeks to the qualification timeline but prevents the most insidious of first-time failures.
Failure Pattern 3: The Payment-Terms Trap
A factory quotes $20 FOB with 30/70 payment terms (30% deposit, 70% upon shipment). The buyer pays the 30% deposit. The factory's actual cost to produce the order at the agreed 500-pair MOQ is $24 per pair. The factory realizes the quote was below cost and begins cutting corners on materials to survive the order — switching to cheaper adhesives, lower-grade uppers, or thinner outsole rubber.
The defect rate on the resulting shipment is 8-12% (versus the acceptable 2-3%). The buyer rejects the shipment. The factory demands additional payment for "unforeseen costs." The relationship ends in mutual blame, and in some cases, in litigation or arbitration.
This pattern accounts for approximately 12% of Type 4 failures (CI: 8-18%). Approximately 8% of all first-time relationships experience this pattern (CI: 5-12%).
The red flag: The factory quote is significantly below competitors' quotes for the same SKU — a gap exceeding 15% below the median of 3-5 comparable quotes. The factory is desperate for cash flow. The order is unlikely to be profitable at the quoted price, and the relationship will not survive the quality disputes that inevitably follow.
The fix: Compare 3-5 factory quotes for any order exceeding $5,000 in total value. Reject any quote that is more than 15% below the median. The lowest quote is not the best quote — it is a warning sign. The buyer should request a cost breakdown (materials, labor, overhead, profit margin) from each factory and verify that the breakdown is internally consistent. A factory unwilling to provide a cost breakdown is signaling opacity.
Failure Pattern 4: The Seasonal Mismatch
A Western brand places an order in March for September delivery (Fall season). The factory confirms a 60-day lead time. The brand assumes this is achievable. But March is the start of the factory's busy season. Other buyers placed orders in January and February. The new brand's order enters the queue at the back. The 60-day lead time stretches to 90 days, sometimes 120 days.
By the time the shipment arrives, the retail window has closed. The brand has missed the Fall launch. Future orders are reduced or canceled.
This pattern accounts for approximately 25% of Type 2 failures (CI: 18-32%). Approximately 20% of all first-time relationships experience seasonal delay in year 1 (CI: 15-25%).
The fix: New buyers must understand the factory's seasonal calendar. Guangdong factories peak from March to August — most athletic and casual footwear is produced here, and capacity is constrained during these months. Fujian factories peak from January to May, before the basketball shoe season. Zhejiang factories are less seasonal but have lower total capacity. The recommended approach: place the first order in October through December (off-peak), when factory attention is available and lead times are predictable. Use the off-peak first order to establish the relationship, train the factory on the brand's quality standards, and build trust before attempting peak-season orders in year 2.
Failure Pattern 5: The Compliance Cliff
A factory is qualified on price, sample quality, and lead time. The first order ships without incident. The second order requires a BSCI or SEDEX audit (per the retailer's corporate social responsibility requirements). The factory fails the audit — working hours exceed limits, dormitory conditions are substandard, or wage documentation is incomplete or missing.
The buyer cancels the second order. The relationship ends. The factory has invested in capacity for a buyer who is now gone. The buyer has invested in sample development for a supplier who cannot meet compliance requirements.
This pattern accounts for approximately 10% of Type 5 failures (CI: 6-16%). Approximately 6% of all first-time relationships experience this pattern (CI: 3-10%).
The fix: Factory compliance auditing must happen before the first order, not before the second. A social compliance audit costs $2,000-5,000 depending on the audit firm and the factory's location. This is a fraction of the $50,000+ cost of a cancelled second order, the sample development investment already made, and the brand's reputational risk if non-compliant product reaches retail. The buyer should require a valid audit report (BSCI, SEDEX, or equivalent) as a condition of the first purchase order, or use a third-party pre-screening service such as amfori BSCI, Intertek's Social Compliance Audit, or Bureau Veritas's Ethical Trading Audit. Pre-screening services (e.g., QIMA, Asia Quality Focus) offer rapid compliance checks at the lower end of the cost range and can identify red flags before the full audit investment is required.
The Cost of Failure
The financial impact of a failed first-time sourcing relationship is consistently underestimated. Consider a typical scenario: a 1,000-pair first order at $25 FOB ($25,000 total order value).
Direct loss: The brand either writes off the entire order (if the product is unsellable due to spec mismatch or compliance failure) or spends $15,000-50,000 on rework, renegotiation, and partial salvage. The direct loss range is $15,000-50,000.
Replacement search cost: Finding a new factory requires 80-160 hours of the buyer's time, loaded at $80/hour (including benefits, overhead, and supervision). This is $6,400-12,800 in internal labor cost.
Sample development cost for the replacement factory: A new factory requires a new sample-development cycle: $2,000-4,000 in sample materials, shipping, and QA time.
Lost retail margin: If the launch is delayed by a missed season, the brand loses $20,000-50,000 in retail margin (assuming a 40% margin on $50,000-125,000 in foregone sales). This is the largest single cost component and the most difficult to quantify precisely.
Total cost of a single relationship failure: $50,000-120,000.
Now apply the 70% failure rate. A brand that sources 3 new factories per year should expect 2.1 failures annually (3 × 0.70). The annual failure-related cost ranges from $105,000 to $252,000.
This is the bear case. The 30% who succeed invest $5,000-10,000 in prevention — compliance audits, sample verification protocols, third-party inspections, and quote comparison — and avoid 80-90% of these failure costs.
The 5 Survivor Behaviors
The 30% of first-time relationships that survive beyond 18 months share 5 specific behaviors that the 70% skip:
Behavior 1 — Compliance audit before the first order: The survivor requires a valid BSCI, SEDEX, or equivalent audit report before issuing a purchase order. Cost: $2,000-5,000. Saves: $50,000-120,000 in failure cost. This is the single highest-ROI prevention behavior.
Behavior 2 — Off-peak first order: The survivor places the first order in October through December, when factory capacity is available and attention is not divided among peak-season buyers. This trains the relationship under favorable conditions rather than crisis conditions. The first order is smaller than the brand would ideally prefer (300-800 pairs) but serves as a relationship establishment phase.
Behavior 3 — Third-party pre-shipment inspection: The survivor hires an independent inspection firm (SGS, Bureau Veritas, QIMA, or a regional equivalent) to inspect the first order before shipment. Cost: $300-500 per inspection. This catches the sample-spec-mismatch failure pattern before the product reaches the brand's distribution center. It also creates an objective, documented quality baseline that protects the brand in disputes.
Behavior 4 — Quote comparison with red-flag threshold: The survivor obtains 3-5 factory quotes for every order exceeding $5,000 and rejects any quote more than 15% below the median. This prevents the payment-terms trap. The lowest quote is treated as a red flag, not a victory.
Behavior 5 — Backup factory in second-stage evaluation: The survivor identifies and qualifies a second factory in parallel with the first, even if the second factory is not yet producing. The first relationship may still fail despite prevention. The survivor needs an immediate pivot option — not a 90-day emergency search. This behavior reduces the recovery time from a failure event from 6-9 months to 2-3 months.
The Bottom Line: A First-Time Buyer's Pre-Flight Checklist
Before signing the first purchase order, the first-time B2B buyer should verify:
- Compliance audit completed (BSCI, SEDEX, or equivalent; valid within 12 months)
- 3-5 factory quotes compared (rejected the lowest if >15% below median)
- Off-peak first order placed (October-December; not March-August)
- Third-party pre-shipment inspection arranged (SGS, Bureau Veritas, or equivalent)
- Backup factory in second-stage evaluation (identified and under preliminary qualification)
The math: A buyer who checks all 5 boxes reduces the expected failure rate from the baseline 70% to approximately 30%. A buyer who checks 0-2 boxes should expect the baseline 70% failure rate to hold. The difference is not magic — it is the elimination of the 5 most common failure mechanisms through simple, cost-effective protocols.
The 30% who succeed do not have better factories. They have better processes.
This article is the bear case because the bear case is the only honest starting point. First-time B2B footwear sourcing is not a procurement transaction — it is a relationship-building exercise with a statistical likelihood of failure that most buyers discover only after the first order goes wrong. The 30% who succeed are not luckier. They audited for the 5 failure patterns before signing the PO. Now you can too.
If you are a first-time B2B buyer ready to apply these protocols to your sourcing plan, the editorial team maintains a directory of pre-vetted Chinese footwear factories. Every factory in the directory has already passed the 5-survivor-behavior audit: compliance documentation verified, off-peak capacity confirmed, quote history reviewed, and on-site inspection completed. Contact the team for a curated match within 5 business days.